Dental Overbooking vs. Underbooking: Finding the Balance
Dental overbooking creates chaos. Underbooking kills production. Learn how to find the right balance with data-driven scheduling strategies that work.
Share:
Table of contents
Dental overbooking is the panic response to no-shows. Empty chairs have burned you, so you schedule 35 patients into 28 slots and hope that the usual 15% won't show. When they all show up? Chaos. Patients wait 40 minutes past their appointment time, your hygienist is sprinting between rooms, and your online reviews take the hit. The opposite problem, underbooking, is quieter but just as expensive. Two empty hours a day at $350 per hour is $154,000 in lost production per year. Later, you'll see where DentalBase's practice services fit in.
Both problems stem from the same root: a reactive schedule built on guesswork rather than data. This article breaks down why dental overbooking and underbooking happen, what each costs you, and how to build a schedule that stays productive without burning out your team or your patients.
What Causes Dental Overbooking and Underbooking?
Dental overbooking happens when practices compensate for anticipated no-shows by scheduling more patients than they can actually see in the available time, while underbooking is the overcorrection that leaves chairs empty. The intent is rational, but the execution is a gamble.
If your no-show rate is 15% and you overbook by 15%, you'll hit capacity on average. But averages mask the days when everyone shows up and the days when half the schedule falls apart.
Common Triggers for Dental Overbooking
The most common triggers for overbooking include:
- A history of high no-show rates without systems to address them
- Aggressive daily production targets set without adjusting for realistic capacity
- Underestimating procedure times
That last one is easy to miss. A practice that blocks 45 minutes for a crown prep that consistently takes 70 minutes will overbook by default, even without adding extra patients.
What Drives Underbooking
Underbooking has the opposite triggers. Practices that have been burned by chaotic, overbooked days often overcorrect. They stop double-booking entirely, pad every appointment with extra buffer time, and accept long scheduling lead times that leave gaps when patients cancel. Without a waitlist system to fill cancellations, those gaps stay empty.
Both problems share one cause: the schedule is built around assumptions instead of data. Your PMS has the data to show your actual no-show rate by day of week, provider, and appointment type. Your no-show rate benchmarks tell you where you stand relative to industry averages. The fix starts with knowing your numbers.
OVERBOOKING VS. UNDERBOOKING
Two sides of the same scheduling problem
Overbooking Signs
❌ Patients waiting 20+ minutes past the scheduled time
❌ Team running behind by mid-morning
❌ Rushed case presentations and lower acceptance
❌ Negative reviews mentioning wait times
Underbooking Signs
❌ Multiple empty chair hours each week
❌ Production consistently below daily target
❌ Team idle during mid-afternoon slots
❌ High overhead-to-production ratio
Common benchmark: 85-90% chair utilization. Below 80% = underbooking. Above 95% = overbooking.
www.dentalbase.ai
Related: Patient no-shows usually have root causes you can fix before touching the schedule. Why Dental Patients No-Show: 7 Root Causes and Fixes →
How Does Overbooking Hurt Your Practice and Patients?
Dental overbooking damages patient satisfaction, team morale, and your online reputation simultaneously. It's the scheduling equivalent of borrowing from tomorrow to pay for today: the short-term production gain comes with compounding long-term costs that land in the waiting room, the break room, and your Google reviews.
Longer Waits and Lost Goodwill
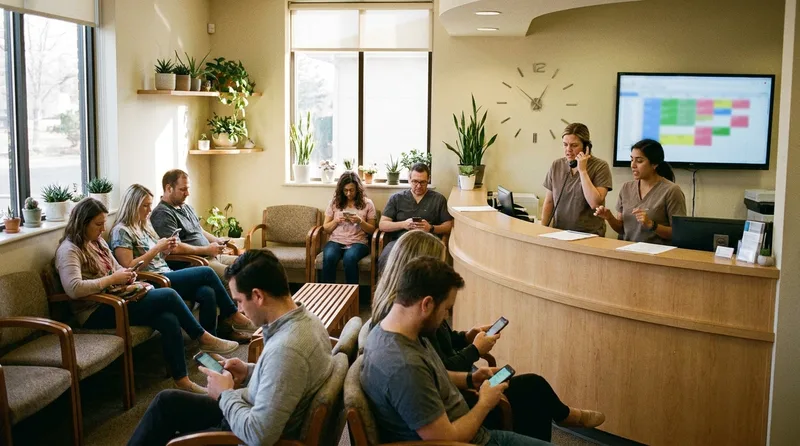
Patient wait time is the most visible casualty. The ADA's dental care market research lists the inability to find a convenient appointment time as one of the top reasons adults avoid the dentist. When patients who did show up on time are kept waiting 30-40 minutes, you're punishing the exact behavior you want to encourage. Those patients won't complain to your face. They'll complain on Google.
Rushed Care and Lower Case Acceptance
Rushed care is the clinical risk. When three patients are waiting, and you're running 25 minutes behind, corners get cut. Case presentations get shorter. Treatment acceptance drops because the patient feels like a number on an assembly line, not an individual. For a deeper look at how experience affects long-term patient behavior, see our patient retention guide.
Team Burnout and Turnover
Team burnout is the hidden cost. Your front desk absorbs the patient's frustration. Your hygienists scramble between rooms. Your assistants prep and re-prep when the schedule shuffles. According to a Dental Economics analysis, a poor scheduling system can leave everyone on the team, doctor included, dreading the workday. That feeds burnout and turnover in a market where dental staff are already hard to find.
That retention risk is sharper for hygienists specifically. With the dental hygienist shortage making that seat harder to backfill, a schedule that burns out the hygienist you already have is a more expensive mistake than it used to be.
Stop Guessing Who's Coming
An AI receptionist confirms every appointment automatically, so you know your actual attendance before the day starts.
Learn About AI Receptionist →What Does Underbooking Actually Cost You?
Underbooking costs your practice the same money as no-shows, just without anyone to blame. An empty chair generates zero production, but your overhead keeps running: staff salaries, rent, utilities, insurance, equipment leases. Every hour of idle chair time is pure loss.
| Empty Chair Time | At $250/hr Production | At $350/hr Production | At $450/hr Production |
|---|---|---|---|
| 1 hour/day | $55,000/yr | $77,000/yr | $99,000/yr |
| 2 hours/day | $110,000/yr | $154,000/yr | $198,000/yr |
| 3 hours/day | $165,000/yr | $231,000/yr | $297,000/yr |
Based on 220 working days per year.
Why Practices Underbook Without Noticing
The psychology of underbooking is worth understanding. Practices that underbook often do so because they've been punished by overbooking in the past. The front desk got yelled at by waiting patients. The doctor was stressed. The team decided, informally, to "leave breathing room." That breathing room turns into $100,000+ in annual lost production if it's not managed intentionally.
If a practice sustains one no-show per day for a year, the revenue loss reaches $20,000 to $70,000, according to Dental Economics. But voluntarily leaving that same time empty through underbooking produces the same loss, just without tracking it. For the exact math on your practice, use our no-show cost calculator.
Related: Chair utilization is one of several numbers worth tracking every month. Dental KPIs Every Practice Owner Should Track in 2026 →
How Do You Find the Right Scheduling Balance?
The right scheduling balance starts with knowing your actual no-show rate, not the rate you assume. Pull your PMS data for the last 90 days and calculate the rate by appointment type, provider, and day of week. That granular data tells you where overbooking is justified and where it's reckless.
Turn No-Show Data Into Booking Decisions
For example, if your Monday new-patient no-show rate is 22% but your Thursday hygiene rate is 6%, you might strategically schedule one extra new patient on Monday afternoons (with a buffer slot nearby) while leaving Thursday hygiene at capacity. That's data-informed scheduling.
Here's the dental overbooking math for the 35-into-28 day from the introduction. At a 15% no-show rate, 35 booked patients means about 30 arrivals (35 x 0.85 = 29.75) for 28 slots. Booking 33 gets you to about 28, but if all 33 show up, five patients wait. That's why a buffer slot matters more than the exact number.
Dental Overbooking Break-Even Math
Patients to book into a 28-slot day
6% no-show rate
30 booked
About 28 arrive; 2 over if all show
15% no-show rate
33 booked
About 28 arrive; 5 over if all show
22% no-show rate
36 booked
About 28 arrive; 8 over if all show
Illustrative math: slots / (1 - no-show rate), rounded up.
www.dentalbase.ai
Put that into practice with three steps that prevent dental overbooking:
- Pull 90 days of PMS data and calculate no-show rates by appointment type, provider, and day.
- Add extra bookings only where rates stay high, with a buffer slot nearby.
- Keep 10-minute buffers between complex procedures.
Block Scheduling by Procedure Type
Divide your day into production blocks rather than treating every slot as equal. A Dental Economics scheduling method sorts procedures into high-income work (preps, seats, restorative) and lower-income work (re-cements, bite adjustments, hygiene exams), then allows only one lower-income procedure per hour.
Reserve prime morning blocks for high-value procedures and schedule shorter, lower-risk appointments later in the day, where a late cancellation costs less.
Buffer Time and Open Operatories
Buffer time matters. A 10-minute buffer between complex procedures prevents the cascade effect where one appointment running long pushes everything back. Buffer time works as insurance against the domino effect that turns a single late start into an entire afternoon of angry patients.
For practices with multiple operatories, our scheduling optimization guide covers how to rotate the doctor between chairs efficiently. The goal is to maintain at least one open operatory slot per half-day for emergency patients and quick procedures, which reduces the temptation to overbook when a patient calls needing same-day care.
Which Scheduling Systems Prevent Both Problems?
The systems that prevent dental overbooking and underbooking simultaneously are automated waitlists, real-time confirmation tracking, risk-based scheduling rules, and same-day booking for specific patient segments. These tools replace the guesswork that creates both problems. Each one targets a different gap.
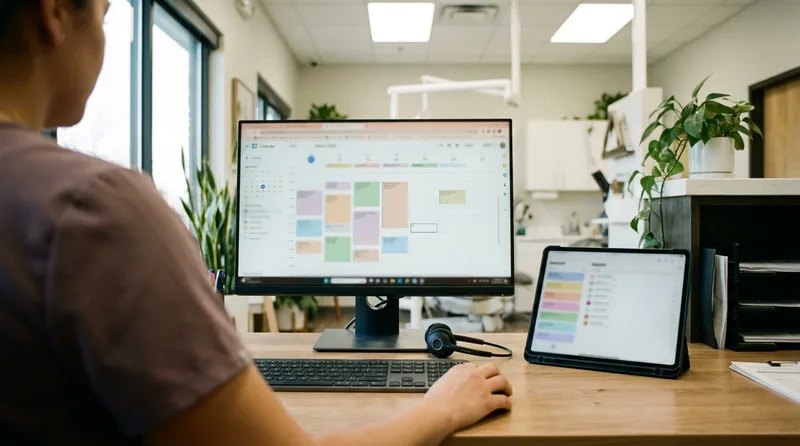
Waitlists and Confirmation Tracking
Automated waitlists are the single most effective tool for underbooking. When a patient cancels, the system immediately notifies patients on the waitlist that a slot has opened. This fills gaps without requiring your front desk to manually call through a list while also managing check-ins. According to Dental Economics, 90% of dental offices aren't using automated waitlists, and only 15% of cancelled appointments get filled through traditional methods.
Real-time confirmation tracking prevents overbooking by showing you who's actually coming. If your 2 PM to 4 PM block has six patients scheduled and only three have confirmed by the morning, you know you likely have room to add a same-day patient. Without confirmation data, you're flying blind, and blind scheduling is how you end up with either seven patients at 2 PM or two.
Multi-Touch Reminders
Multi-touch reminders reduce both problems by shrinking your no-show rate. Text reminders cut dental no-shows from 31% to 14% in a study cited by Dental Economics. When your no-show rate drops from 15% to 7%, the need to overbook disappears, and the gaps that cause underbooking shrink.
WHICH TOOL FIXES WHICH PROBLEM
| Tool | Helps prevent overbooking | Helps prevent underbooking |
|---|---|---|
| Automated waitlists | Less pressure to pad the book | Refills cancelled slots fast |
| Confirmation tracking | Shows who is really coming | Reveals room for same-day adds |
| Multi-touch reminders | Lower no-show rate | Fewer gaps to refill |
| Same-day booking for high-risk patients | Fewer predictable misses | Fills last-minute gaps |
www.dentalbase.ai
Same-Day Booking for High-Risk Patients
For patients with a documented history of no-shows, restrict them to same-day or next-day booking only. This prevents them from occupying a slot three weeks out that they'll likely miss, while still giving them access to care. It also fills last-minute gaps created by other cancellations. A deposit requirement for these patients adds another layer of commitment. Pair this with a clear no-show policy so the patient understands why the restriction exists.
Fill Gaps and Prevent Pileups Automatically
DentalBase automates confirmations, waitlist notifications, and follow-ups so your schedule stays full without overbooking.
Book a Free Demo →How Do You Measure Whether Your Schedule Is Working?
Track four metrics monthly to know whether your schedule is balanced: chair utilization rate, production per scheduled hour, average patient wait time, and daily production variance. Together, these KPIs tell you if you're overbooking, underbooking, or hitting the sweet spot.
SCHEDULE HEALTH KPIs
Four metrics that reveal overbooking and underbooking
85-90%
Chair Utilization
% of available hours with patients
<10 min
Wait Time
Past scheduled appointment time
±15%
Daily Variance
Production swing from the daily target
$/hr
Production Rate
Revenue per scheduled chair hour
www.dentalbase.ai
Chair Utilization and Production per Hour
Chair utilization rate is the percentage of available chair hours that are actually used for patient care. A common benchmark is 85-90%. Below 80% means you're underbooking or losing too many patients to cancellations. Above 95% consistently means you're likely overbooking and don't have room for emergencies or overruns.
Production per scheduled hour shows whether you're filling your time with the right mix of procedures. If your hourly production is well below your goal despite a full schedule, you may have too many low-production appointments and not enough high-value blocks. A full schedule with weak hourly production points to a scheduling design problem.
Wait Time and Daily Variance
Average patient wait time is the clearest overbooking signal. If patients regularly wait more than 10 minutes past their scheduled time, your schedule is too tight. Track this by having your front office note the actual seating time versus the scheduled time for one week per month.
Daily production variance measures how much your production swings from day to day. High variance (some days at $12,000, others at $4,000) indicates inconsistent scheduling. Aim for most days to fall within 15% of your target. Treat these as rules of thumb, not published standards.
Aim for a predictably productive schedule, even if it never looks perfectly full. Dental overbooking fills every slot on paper but creates unpredictable chaos in practice. Underbooking avoids the chaos but leaves money on the table. The practices that get this right use their data to schedule at 85-90% capacity, fill gaps with automated waitlists, and reserve buffer time that prevents the cascade effect. Start by pulling your no-show rate by day and provider this week. That single data point will tell you whether your instinct to overbook or underbook is costing you.
Ready to Build a Smarter Schedule?
See how DentalBase helps practices balance their schedules with automated confirmations, waitlists, and production tracking.
Book a Free Demo →Looking for more practice growth resources?
Browse Resources →Sources & References
- The Economic Impact of No-Shows at Dental Clinics - Dental Economics
- Tips to Maximize Your Schedule - Dental Economics
- Scheduling for Success - Dental Economics
- Why Patient Self-Scheduling Isn't Optional Anymore - Dental Economics
- How Can Dentists Reduce No-Shows with Texting - Dental Economics
- The Dental Care Market - ADA Health Policy Institute
Frequently Asked Questions
Dental overbooking is typically caused by fear of no-shows, aggressive production targets, and underestimating procedure times. Practices schedule more patients than they can see, hoping that cancellations will create the needed space. When everyone shows up, the result is long waits and rushed care.
One empty chair hour per day costs $55,000 to $99,000 annually depending on your production rate. Two empty hours doubles that to $110,000-$198,000. The cost runs even without tracking it because staff salaries, rent, and overhead continue regardless of patient volume.
A commonly cited target is 85-90% chair utilization. Below 80% indicates underbooking or high cancellation rates. Above 95% consistently suggests overbooking with no room for emergencies or appointment overruns. The remaining 10-15% provides buffer for same-day patients and schedule flexibility.
Replace blanket overbooking with data-informed scheduling. Calculate your no-show rate by day, provider, and appointment type. Add one strategic extra appointment only on days with historically high no-show rates, paired with buffer time. Use automated waitlists to fill gaps from cancellations.
Strategic double-booking can work for specific scenarios, like scheduling a quick exam during a hygiene visit in another operatory. Blanket double-booking to compensate for no-shows creates unpredictable chaos and should be replaced with confirmation tracking and waitlist systems.
Block scheduling divides the day into production categories. High-value procedures like crowns and other restorative work typically get the prime morning blocks, while lower-value visits like re-cements and adjustments fill later slots. This keeps daily production consistent and stops the schedule from filling with low-revenue visits.
When a patient cancels, the automated waitlist immediately notifies flexible patients that a slot is open. This fills gaps without manual phone calls. According to Dental Economics, only about 15% of cancelled appointments get filled through traditional methods, which is why practices add automated waitlists.
Review scheduling KPIs monthly: chair utilization, production per hour, patient wait time, and daily production variance. Pull no-show rates by day of week and provider quarterly. Adjust scheduling templates based on the patterns these reports reveal.
Was this article helpful?
Written by
DentalBase Team
Expert dental industry content from the DentalBase team. We provide insights on practice management, marketing, compliance, and growth strategies for dental professionals.