
Dental AI Receptionist ROI: DentiVoice Call Analytics
See how DentiVoice call analytics reveal which calls became booked appointments, your missed call rate, and real dental AI receptionist ROI each week.
Share:
Table of contents
Your phone rang 47 times last week. How many became appointments? Most practice owners cannot answer that, and the gap is where money quietly leaks out. Measuring dental AI receptionist ROI starts with one honest admission: you probably have no baseline for what your phone line produces. Our complete guide to the DentalBase AI receptionist walks through how all of this comes together.
You know the phone rings. You do not know how many calls were answered, how many turned into booked visits, or how much revenue walked to the practice down the street. Without that data, every front-desk decision is a guess. DentiVoice closes the gap by reporting on every call it handles, and it pairs those numbers with the rest of the DentalBase growth tools so acquisition cost and booked production finally sit in one view.
This update explains what the call analytics dashboard tracks, how revenue attribution works, and why a weekly scorecard changes how you run the front desk.
What this update covers
- What the call analytics dashboard actually tracks
- How revenue attribution connects a call to a booked appointment
- Why a weekly scorecard changes front-desk decisions
What is dental AI receptionist ROI, and how is it measured?
Dental AI receptionist ROI is the recovered revenue an AI phone system produces against its cost. You measure it by tracking answered calls, booking conversion, and the value of appointments that would otherwise be missed. A single missed new patient call costs more than $1,200 in lifetime value, according to Dental Economics.
That figure is the hinge. If a tool recovers even a handful of those calls each month, the math moves fast. The average dental practice misses 15 to 20 calls per week, Dental Economics reports, and most never come back. Return on investment here is not abstract. It is the count of calls saved, multiplied by what a booked patient is worth. To see how that recovered-call value compares with the full cost of a tool, including setup and training, work through a total-cost formula for dental technology ROI.
What the ROI dashboard actually measures
| Dashboard metric | What it answers | Why it drives revenue |
|---|---|---|
| Answer rate | Share of inbound calls picked up | Unanswered calls rarely call back |
| Booking conversion | Answered calls that became appointments | Turns call volume into scheduled production |
| After-hours capture | Calls booked outside office hours | Recovers demand the front desk never sees |
| Recovered revenue | Estimated value of calls saved vs baseline | Ties the tool to dollars, not activity |
Average patient lifetime value for a general dentist runs $12,000 to $15,000. Set that against the $150 to $300 cost to acquire a new patient through digital channels, and one recovered call can outweigh a month of ad spend.
One platform, one scorecard
DentiVoice call analytics sit alongside the rest of the DentalBase growth stack, so acquisition spend and booked production read in the same place.
Explore DentalBase services →Why do most dental practices have no visibility into their call data?
Most practices lack call visibility because the phone system was built to connect calls, not to measure them. The front desk answers when it can, voicemail catches the rest, and nobody logs the outcome. So the single largest source of new patients runs on guesswork.
Think about a three-provider practice taking 200 calls a week. During a busy Monday, two lines ring while the desk checks in a patient and verifies insurance. One call rolls to voicemail. ADA practice resources note that phone handling is among the most common front-desk breakdowns, yet few offices review it. Why? Because the data was never captured in the first place.
What most practices never capture
- No answer-rate tracking. The desk cannot tell you what share of calls it actually picked up last week.
- No outcome logging. A call that ends without a booking looks identical to one that never happened.
- No after-hours record. Calls that hit voicemail at 7 p.m. disappear by morning.
- No baseline. With nothing to compare against, you cannot prove any change helped or hurt.
That is the real problem. Not that calls get missed, but that missed calls leave no trace to learn from.
What does the DentiVoice call analytics dashboard track?
The DentiVoice dashboard tracks call volume, answer rate, booking conversion rate, after-hours capture, and estimated revenue impact, refreshed weekly. It shows at a glance what the AI receptionist handled and what that handling was worth to the schedule. For a closer look at everything this dashboard captures on every call, see what your call data actually reveals with DentiVoice.

Each metric answers a specific question a practice owner already asks out loud. How many calls came in? How many did we catch? How many turned into chair time? The dashboard puts those answers in one place instead of scattered across a phone bill and a hunch.
The four metrics on the dashboard
- Call volume and answer rate. Total inbound calls and the share picked up, so coverage gaps show immediately.
- Booking conversion rate. The percentage of answered calls that became a scheduled appointment.
- After-hours capture. Calls answered and booked outside office hours, a slice most practices never quantify.
- Estimated revenue impact. A dollar estimate tied to the calls DentiVoice recovered versus baseline.
One more reason weekly numbers matter now: search behavior is shifting under practices' feet. Google Search Central guidance shows more patients starting with a question and fewer clicking through, which pushes more of the decision onto the phone call itself. When the call carries more weight, measuring it stops being optional.
Related: After-hours answering is one of the biggest sources of recovered calls in the dashboard. How DentiVoice answers after hours →
How does revenue attribution connect calls to booked appointments?
Revenue attribution links each handled call to its outcome, then estimates the value of appointments recovered against your baseline miss rate. It answers the question every owner wants settled: which calls turned into money, and which slipped away?
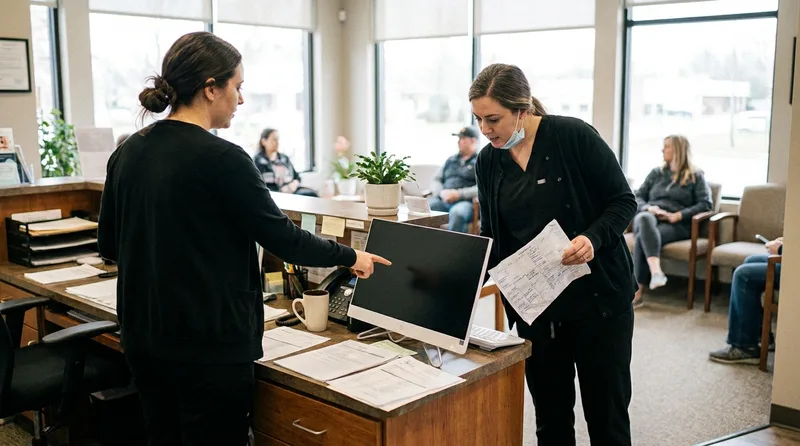
The model is simple to read. DentiVoice records the calls it answered, flags the ones that booked, and applies your practice's average patient value to the recovered visits. Because independent research on consumer behavior shows most people move on after one failed contact attempt, a recovered call is not a maybe. It is a patient who would likely be gone.
Attribution also reads intent. New patient calls, existing patient calls, and general inquiries each behave differently, and the dashboard separates them. This matters for planning: staffing projections tie directly to the dental workforce outlook, and knowing your real new-patient call flow helps you hire against demand rather than fear.
How the attribution model works
- Every answered call is logged, then flagged as booked or not booked
- Your practice's average patient value is applied to the recovered visits
- New patient calls, existing patient calls, and general inquiries are tracked separately
DentiVoice answers, books, and reports on every call
The same AI receptionist that captures after-hours and overflow calls also logs each one, so your dashboard reflects real handled volume.
See the AI Receptionist →How do you read booking conversion rate the right way?
Read booking conversion as the percentage of answered calls that ended in a scheduled appointment, then segment it by call type. A blended number hides the truth, because a new patient call and a billing question convert at completely different rates.
Why a blended conversion rate hides the real story
Say your dashboard shows 60% conversion. Sounds strong. But if new patient calls convert at 40% while existing-patient scheduling sits at 85%, the blended figure is masking a real leak on your highest-value calls. Segment first. Then act.
A worked example makes it concrete. Suppose you answer 100 calls in a week: 30 are new patients, 70 are existing patients or billing questions. If 12 of the 30 new patient calls book, that is 40% on the calls that grow the practice. Fix that to 55%, and you have added four or five new patients a week without spending a dollar more on marketing. The blended rate never would have shown you where to push.
The worked example, broken down
- 100 calls answered in a week: 30 new patients, 70 existing patients or billing questions
- 12 of 30 new patient calls book, a 40% conversion rate on the calls that grow the practice
- Raising that to 55% adds four or five new patients a week with no added marketing spend
DentiVoice books directly into the practice management system, so a conversion is a genuine appointment on the schedule, not a message for someone to chase later. That direct write-back is what makes the PMS booking integration numbers trustworthy. And when conversion dips, the common objections to AI reception are usually easier to resolve than owners expect.
For the details of how that live connection stays accurate call after call, see does DentiVoice sync with your practice management software.
Can multi-location practices and DSOs compare performance by location?
Yes. Multi-location groups and DSOs see each location side by side in the same dashboard, using identical definitions for answer rate, booking conversion, and recovered revenue. That shared scorecard turns anecdote into comparison.

One location books 70% of new patient calls. Another books 45% on similar volume. Before shared analytics, that gap stays invisible, buried in two different phone systems and two different front-desk cultures. With it, the regional manager knows exactly where to coach and what the fix is worth.
What a standardized scorecard reveals
- Standardized metrics. Every site is measured the same way, so comparisons are fair.
- Outlier detection. A location with a falling answer rate surfaces before revenue drops.
- Rollup reporting. Group-level totals sit above per-site detail for board and owner review.
For a growing group, that comparison is a hiring and training map. If a Nashua location books 70% of new patient calls while a Concord location manages 45% on similar volume, the regional manager knows where a scripting refresh or an extra coverage shift pays for itself first. It also protects new acquisitions: when a group buys a practice, the first 90 days set the tone, and a quiet drop in answer rate is easy to miss across five locations. Shared analytics catch it before a soft phone line becomes a soft schedule.
What should you do with the call data each week?
Use the weekly dashboard to spot one fixable gap, not to admire the totals. The point of measurement is action: find the metric that moved, ask why, and adjust coverage, scripting, or reactivation before the next report lands.
Related: Reactivation is one of the clearest levers on that dashboard to actually pull. See how DentiVoice turns overdue patients into booked visits →
Here is the rhythm that works. Open the dashboard every Monday. Read answer rate and booking conversion first. If after-hours capture jumps, that is demand you were losing before. If conversion on new patient calls slips, tighten the intake flow. Pair the phone data with your automated reactivation results and your broader follow-up ROI numbers to see the full recovered-revenue picture.
Three questions for the Monday review
Three questions keep the weekly review honest:
- What changed since last week? Direction matters more than any single number.
- Where is the biggest gap to potential? Chase the metric with the most room, not the loudest one.
- What is one change we can test? Adjust scripting, hours, or reactivation cadence, then read the result next Monday.
Data without a habit is just a report. The weekly review is the habit.
Does the dashboard capture calls in every language and time slot?
Yes. The dashboard logs every call DentiVoice handles, including after-hours, overflow, and Spanish-language calls, with summaries recorded in English for the team. Coverage is the whole point: a call the system never answered cannot appear in your numbers.
Because DentiVoice detects and handles Spanish-language calls automatically, those bookings show up in the same conversion and revenue figures as English calls. No separate report, no blind spot. Every handled call, one scorecard.
What full-coverage tracking means in practice
- After-hours, overflow, and Spanish-language calls all log into the same dashboard
- Call summaries are recorded in English for the team regardless of the call's language
- A call the system never answered simply cannot appear in the numbers
For a closer look at how detection, conversation quality, and booking all hold up identically across languages, see how bilingual calls actually work inside DentiVoice.
Consider a practice in a market where a quarter of inbound calls are in Spanish. Before automatic language handling, those calls either hit voicemail or waited for a bilingual staff member who was not always on shift. Each one that dropped never entered the answer-rate or conversion figures, so the reporting understated the real demand. Now Dentrix, Open Dental, or Eaglesoft receives the booking regardless of language, and the dashboard reflects the true call volume.
The bottom line on dental AI receptionist ROI
The bottom line
You cannot improve what you never measure. The reason most practices cannot state their dental AI receptionist ROI is not that the value is missing. It is that the data was never captured, so the return stayed invisible.
A weekly dashboard changes that. It turns your phone line from a black box into a scorecard you can act on. Start by asking for a baseline: what is your answer rate, and what is a booked call worth? Once those two numbers are on the table, every decision after gets easier.
Measurement is not the goal. Better booked production is. But you will never get the second without the first, and the practices that review their call numbers weekly tend to catch leaks months before the ones that do not. Give your phone line a scorecard, and it stops being the most expensive guess in the building.
See what your phone line is actually worth
A short demo walks through a sample DentiVoice dashboard using numbers like your own, so you can read your booking conversion and recovered revenue before you commit.
Book a Free Demo →Sources & References
Frequently Asked Questions
It is the recovered revenue an AI phone system produces against its cost. You measure it by tracking answered calls, booking conversion, and the value of appointments that would otherwise be missed.
DentiVoice records each call it answers, flags the ones that booked, and applies your practice's average patient value to the recovered visits, then compares that against your baseline miss rate.
The call analytics dashboard refreshes weekly. It reports call volume, answer rate, booking conversion, after-hours capture, and estimated revenue impact, so you can open it every Monday and read what changed since the previous week before adjusting coverage or scripting.
Yes. Multi-location groups and DSOs see each location side by side using identical metric definitions, so answer rate and booking conversion are directly comparable across sites. Regional managers can then spot the weakest location and coach against a shared, standardized number.
Yes. Every call DentiVoice handles is logged, including after-hours, overflow, and Spanish-language calls, with summaries recorded in English for the team. A call the system never answered cannot appear in your numbers, so full coverage is what makes the data honest.
Because the phone system was built to connect calls, not measure them. Without answer-rate tracking or outcome logging, a missed call leaves no trace to learn from or improve on.
Was this article helpful?
Written by
DentalBase Team
Expert dental industry content from the DentalBase team. We provide insights on practice management, marketing, compliance, and growth strategies for dental professionals.