
Dental Practice Overhead Benchmarks: What's Normal in 2026
See dental practice overhead benchmarks for 2026, from staff payroll to rent and supplies, and learn how to calculate and improve your own ratio.
Share:
Table of contents
Dental practice overhead benchmarks tell you one thing fast: whether your practice runs lean or bleeds cash into fixed costs. A three-provider general practice collecting $1.8 million a year at 68% overhead keeps about $576,000 before the owner's own pay. Drop that ratio to 60% and the same practice keeps over $720,000.
Most owners guess at their overhead number instead of calculating it, and that habit hides which specific line, payroll, rent, or lab fees, is actually out of line. Staffing, scheduling, and phone coverage all tie into a practice's broader growth strategy, so overhead rarely moves in isolation. This guide breaks down what counts as overhead, what's normal for 2026, and how to calculate your own ratio.
What Counts as Overhead in a Dental Practice?
Overhead is every cost a dental practice pays to stay open, regardless of how many patients it treats that day. It includes staff payroll, rent, utilities, supplies, lab fees, insurance, equipment leases, and marketing. It excludes the dentist's own compensation and practice-level debt service.
Fixed vs. Variable Overhead Costs
Most benchmarking reports split overhead into two buckets: fixed and variable. Fixed costs, rent, insurance premiums, and equipment loan payments, stay roughly flat whether the practice sees 40 patients a week or 80. Variable costs move with volume. Dental supplies, lab fees, and a portion of hygiene payroll scale up as production climbs. According to CDC NCHS data, national spending on dental services has climbed steadily for more than a decade, and that trend shows up in local supply and lab invoices too. A practice that hasn't reviewed its supply contracts or staffing model in three years is almost certainly carrying costs it doesn't need.
Pull the last 12 months of profit and loss data and separate every line into fixed or variable before comparing against any benchmark. Lumping everything into one "operating expenses" bucket hides the real problem. It also makes it nearly impossible to set a realistic budget for next year.
What Are Normal Dental Practice Overhead Benchmarks for 2026?
Normal dental practice overhead benchmarks for 2026 place general practices between 59% and 68% of collections. Specialty practices run lower. Oral surgery and orthodontics often land in the 50% to 62% range, since lab and supply costs make up a smaller share of production.
Those ranges come from a mix of national survey data and reported trends. Groups like the ADA Health Policy Institute track practice economics across thousands of member dentists. Where a given practice lands inside that range depends heavily on payer mix. A practice heavy on PPO reimbursement writes off more per procedure. That pushes the overhead ratio higher even when actual spending stays flat. It's one reason some owners revisit their PPO participation once they see how much reimbursement rates are compressing their margin. Some practices cut PPO dependence altogether by building predictable cash flow through a dental membership plan platform instead.
Overhead Ranges by Practice Type
- General practice, fee-for-service heavy: 55% to 62%
- General practice, PPO heavy: 62% to 68%
- Specialty practice (ortho, oral surgery): 50% to 62%
- Startup or newly acquired practice (year one to two): often 70%+ until volume ramps
Want more financial benchmarking guides?
Browse practical guides on billing, PPO strategy, and revenue tracking for dental practices.
Browse Resources →How Much Should Staff Payroll Cost as a Percentage of Collections?
Staff payroll should run between 25% and 30% of collections for most general practices. It includes hygiene, assisting, and front desk pay, and it's almost always the single largest overhead line item. Practices above 32% usually carry overstaffing or below-market production per provider.

Where Payroll Breaks Down by Role
Hygiene payroll alone typically accounts for 12% to 14% of that total. The rest splits between clinical assistants and administrative staff. Wage pressure has pushed this ratio upward across the industry. Per the Bureau of Labor Statistics, dental support occupations have seen consistent wage growth. Practices are competing for a limited hygienist and assistant pool. A practice's own staffing ratio matters more than the raw payroll dollar figure. Two practices at identical revenue can carry very different headcounts.
Before assuming payroll is too high, check production per provider first. A practice running $180,000 or less in annual production per hygienist will show inflated payroll overhead, even with a lean team. The denominator, not the staffing, is the actual problem. The opposite mistake costs something too, since running payroll too lean to protect the percentage is one way how staffing and overhead decisions end up as dentist burnout.
What Is a Healthy Occupancy and Rent Percentage?
A healthy occupancy percentage for a dental practice sits between 5% and 6% of collections, covering rent, utilities, and property-related insurance. Anything above 8% usually signals a lease that's oversized for current production or a location that hasn't grown into its footprint.
Why Occupancy Spikes Early On
Occupancy is the easiest overhead category to benchmark because it's almost entirely fixed. A practice paying $6,000 a month in rent needs roughly $1.2 million in annual collections to keep occupancy near 6%. Drop collections without renegotiating the lease, and that percentage climbs fast, even though nothing about the space itself changed. This is why occupancy tends to spike in a practice's first two years, before production has caught up to the square footage the owner leased. Watching your production-to-collection gap every week keeps a collections slide from quietly inflating these ratios.
If occupancy is running high, don't assume relocation is the only fix. Subleasing unused operatories, renegotiating at lease renewal, or simply adding a fourth operating day can bring the ratio back in line without a move.
How Much Should Dental Supplies and Lab Fees Cost?
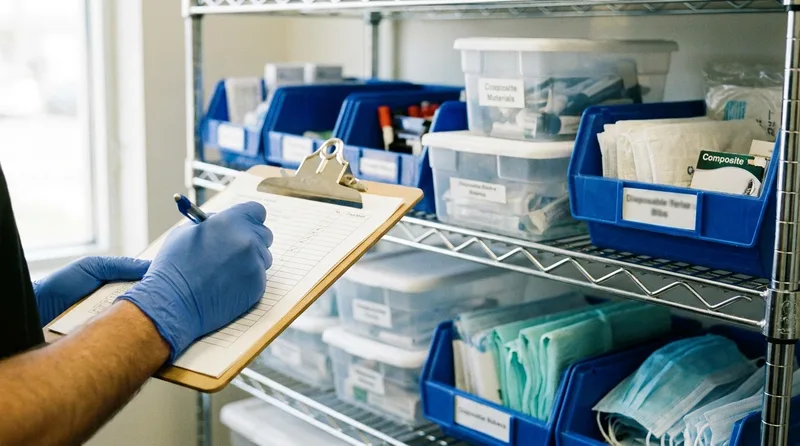
Dental supplies and lab fees combined should run 10% to 12% of collections for a typical general practice, split roughly evenly between the two categories. Practices doing heavier restorative or implant work often see lab fees push toward 8% on their own.
What's Driving Supply and Lab Cost Increases
Supply costs have been volatile since 2023. PPE, composite materials, and disposables have all seen price increases well above general inflation. Research from groups tracking oral health spending, including the National Institute of Dental and Craniofacial Research, points to steady growth in overall dental care costs. That trend touches supply invoices directly. Lab fees follow a similar pattern, especially for practices sending more crown and implant cases to outside labs.
Related: Missed calls quietly inflate every overhead ratio by shrinking the collections side of the equation. See the real cost of missed calls →
Does Overhead Differ Between General and Specialty Practices?
Yes, specialty practices generally run lower overhead than general practices, often by 6 to 10 percentage points. Higher production per procedure spreads fixed costs over a larger revenue base. Orthodontics and oral surgery see this most clearly.
An orthodontic practice billing $8,000 for a full course of treatment covers its chair time and staff cost efficiently. A general practice billing $150 for a routine exam can't match that math. That's not a sign the general practice is mismanaged. Lower average production per visit means fixed costs represent a larger share of every dollar collected. Multi-specialty groups sometimes blend these numbers together. That hides which location is actually underperforming. Practices working on case acceptance on big treatment plans can close some of that production gap without touching the fee schedule.
Overhead by Practice Type
| Practice Type | Typical Overhead | Largest Line Item |
|---|---|---|
| General Practice | 59% to 68% | Staff payroll |
| Orthodontics | 50% to 58% | Staff payroll |
| Oral Surgery | 48% to 60% | Lab and surgical supplies |
| Pediatric Dentistry | 58% to 66% | Staff payroll |
Why Is Dental Practice Overhead Rising in 2026?
Dental practice overhead is rising in 2026 mainly because wage growth for hygienists and assistants has outpaced fee schedule increases from insurance payers. That gap squeezes margin even for practices that haven't changed how they operate at all.
Three Forces Compounding the Problem
Three forces are compounding the problem at once. Hygienist and assistant wages have climbed faster than general inflation in most metro markets. Supply and lab costs haven't fully settled since the disruptions of the early 2020s. PPO reimbursement rates, in many states, have barely moved in five years. Coverage from Dental Economics has tracked this exact squeeze across multiple annual practice surveys. Put those three together, and a practice can do everything right operationally. Its overhead percentage still creeps upward year over year.
Reviewing overhead once a year isn't enough anymore. Quarterly check-ins on payroll, supply spend, and payer mix catch problems while they're still small enough to fix without a painful correction.
Missed calls are a hidden overhead cost
Every unanswered call is lost production that still has to cover the same fixed costs. See how an AI receptionist keeps the phone covered without adding headcount.
See the AI Receptionist →Related: Reimbursement rates are half of the overhead equation, and they're often the easier half to move. See how to negotiate dental insurance rates for your practice →
How Do You Calculate Your Own Overhead Percentage?
Calculate your overhead percentage by dividing total practice expenses, excluding owner compensation and debt principal, by total collections for the same period, then multiplying by 100. Run this monthly, not just at year-end, to catch drift early.
Step-by-Step Overhead Calculation
- Pull total collections for the period from your practice management software, not gross production, since production includes adjustments and write-offs you haven't actually collected.
- List every operating expense: payroll, rent, utilities, supplies, lab, insurance, marketing, and software subscriptions.
- Exclude owner compensation, associate profit distributions, and loan principal payments. Interest on debt does count as overhead.
- Divide total expenses by total collections and multiply by 100 to get your percentage.
- Break the result into sub-categories, payroll, occupancy, supplies, lab, marketing, so you know exactly where the number is coming from.
A practice losing revenue to unanswered phones or chronic schedule gaps will see its overhead percentage climb, even if spending never changes. The denominator shrank, not the spending. Reviewing call answer rates and open chair time alongside the overhead calculation catches that blind spot before it shows up as a bad quarter. That comparison ties your dental practice overhead benchmarks back to real cash flow, not just a spreadsheet exercise.
How Can You Lower Overhead Without Cutting Patient Care?
You can lower dental practice overhead without cutting patient care by targeting the categories that grow through inefficiency rather than through investment in the patient experience. Payroll and phone coverage gaps throughout the day are the two most common places practices find real savings fast.

Cross-training front desk staff to cover clinical scheduling and insurance verification often eliminates the need for a dedicated extra hire. Check-in and check-out don't slow down either. Practices that formalize this through a documented front desk cross-training plan absorb staff turnover far better than practices relying on one irreplaceable employee. The labor market is tight right now. Overpaying to fill a role fast is common, and revisiting how you hire a dental hygienist can prevent that markup from becoming permanent. A front desk team drowning in no-show calls often ends up overstaffed just to keep up with rebooking.
Quick Wins to Audit First
- Audit supply and lab vendor contracts annually, not just when a rep calls
- Cross-train front desk and clinical support staff to reduce headcount dependency
- Route after-hours and overflow calls to an automated system instead of voicemail
- Renegotiate occupancy costs at every lease renewal, not just when rent feels high
- Track production per provider monthly so payroll decisions use current data, not last year's
- Tighten your no-show recovery workflow so canceled slots get rebooked the same day
- Compare AI receptionist options against what after-hours coverage currently costs you
Cutting supply quality or shortening appointment times to save money almost always backfires through redo work or patient attrition. The categories above trim cost without touching what patients actually experience in the chair.
Do Overhead Benchmarks Change for Multi-Location Practices?
Yes, overhead benchmarks shift for multi-location practices, usually downward, because shared administrative staff, centralized purchasing, and group insurance contracts spread fixed costs across more collections. A well-run three-location group often runs 4 to 8 points below a comparable standalone practice.
Why Centralization Matters More Than Location Count
That efficiency isn't automatic. Groups that let each location run its own supply ordering and staffing often see overhead creep back up. It lands right at single-location levels, just spread across more sites. Centralizing purchasing and standardizing staffing ratios is where the real savings come from, not the location count itself. This matters even more during a future sale. Buyers scrutinize overhead trends closely during succession planning and valuation.
Consolidated overhead that matches your least efficient site is a signal. Centralize purchasing and staffing decisions before adding a fourth location.
Dental practice overhead benchmarks only matter if you calculate your own number and compare it against the right category, not a generic industry average. A PPO-heavy general practice will never match a fee-for-service specialty practice's ratio. Forcing that comparison wastes time better spent on payroll efficiency, supply contracts, and phone coverage, the categories you can actually control. Start with one number this month. Calculate your actual overhead percentage. Break it into payroll, occupancy, and supplies, then compare each piece against the ranges above.
Related: Software sits inside your administrative overhead line, and the quoted monthly fee is rarely the real number. Read what dental practice management software actually costs across 36 months.
See where your overhead is leaking revenue
Book a free demo to see how DentalBase helps practices track collections, staffing, and missed-call revenue in one place.
Book a Free Demo →Want more practice finance guides like this one?
Browse Resources →Related: Understanding your numbers is one skill; learning to manage them is another. our list of practice management books that cover the financial side of ownership is worth bookmarking.
Sources & References
Frequently Asked Questions
A good overhead percentage for a general dental practice falls between 59% and 68% of collections. Specialty practices like orthodontics often run lower, closer to 50% to 62%, because production per visit is higher.
Staff payroll should run 25% to 30% of collections for most general practices. Above 32% usually points to overstaffing or low production per provider rather than a payroll problem on its own.
Overhead is rising mainly because hygienist and assistant wages have grown faster than PPO reimbursement rates. Supply and lab costs have also stayed elevated since the early 2020s, squeezing margin industry-wide.
Divide total operating expenses, excluding owner compensation and debt principal, by total collections for the same period, then multiply by 100. Run this monthly and break it into payroll, occupancy, and supplies.
Yes, specialty practices usually run 6 to 10 percentage points lower overhead than general practices. Higher production per procedure spreads fixed costs like rent and payroll over more revenue.
70% overhead is high for an established general practice but normal for a startup or newly acquired practice still ramping up volume. If it persists past year two, payroll and payer mix need review.
Was this article helpful?
Written by
DentalBase Team
Expert dental industry content from the DentalBase team. We provide insights on practice management, marketing, compliance, and growth strategies for dental professionals.